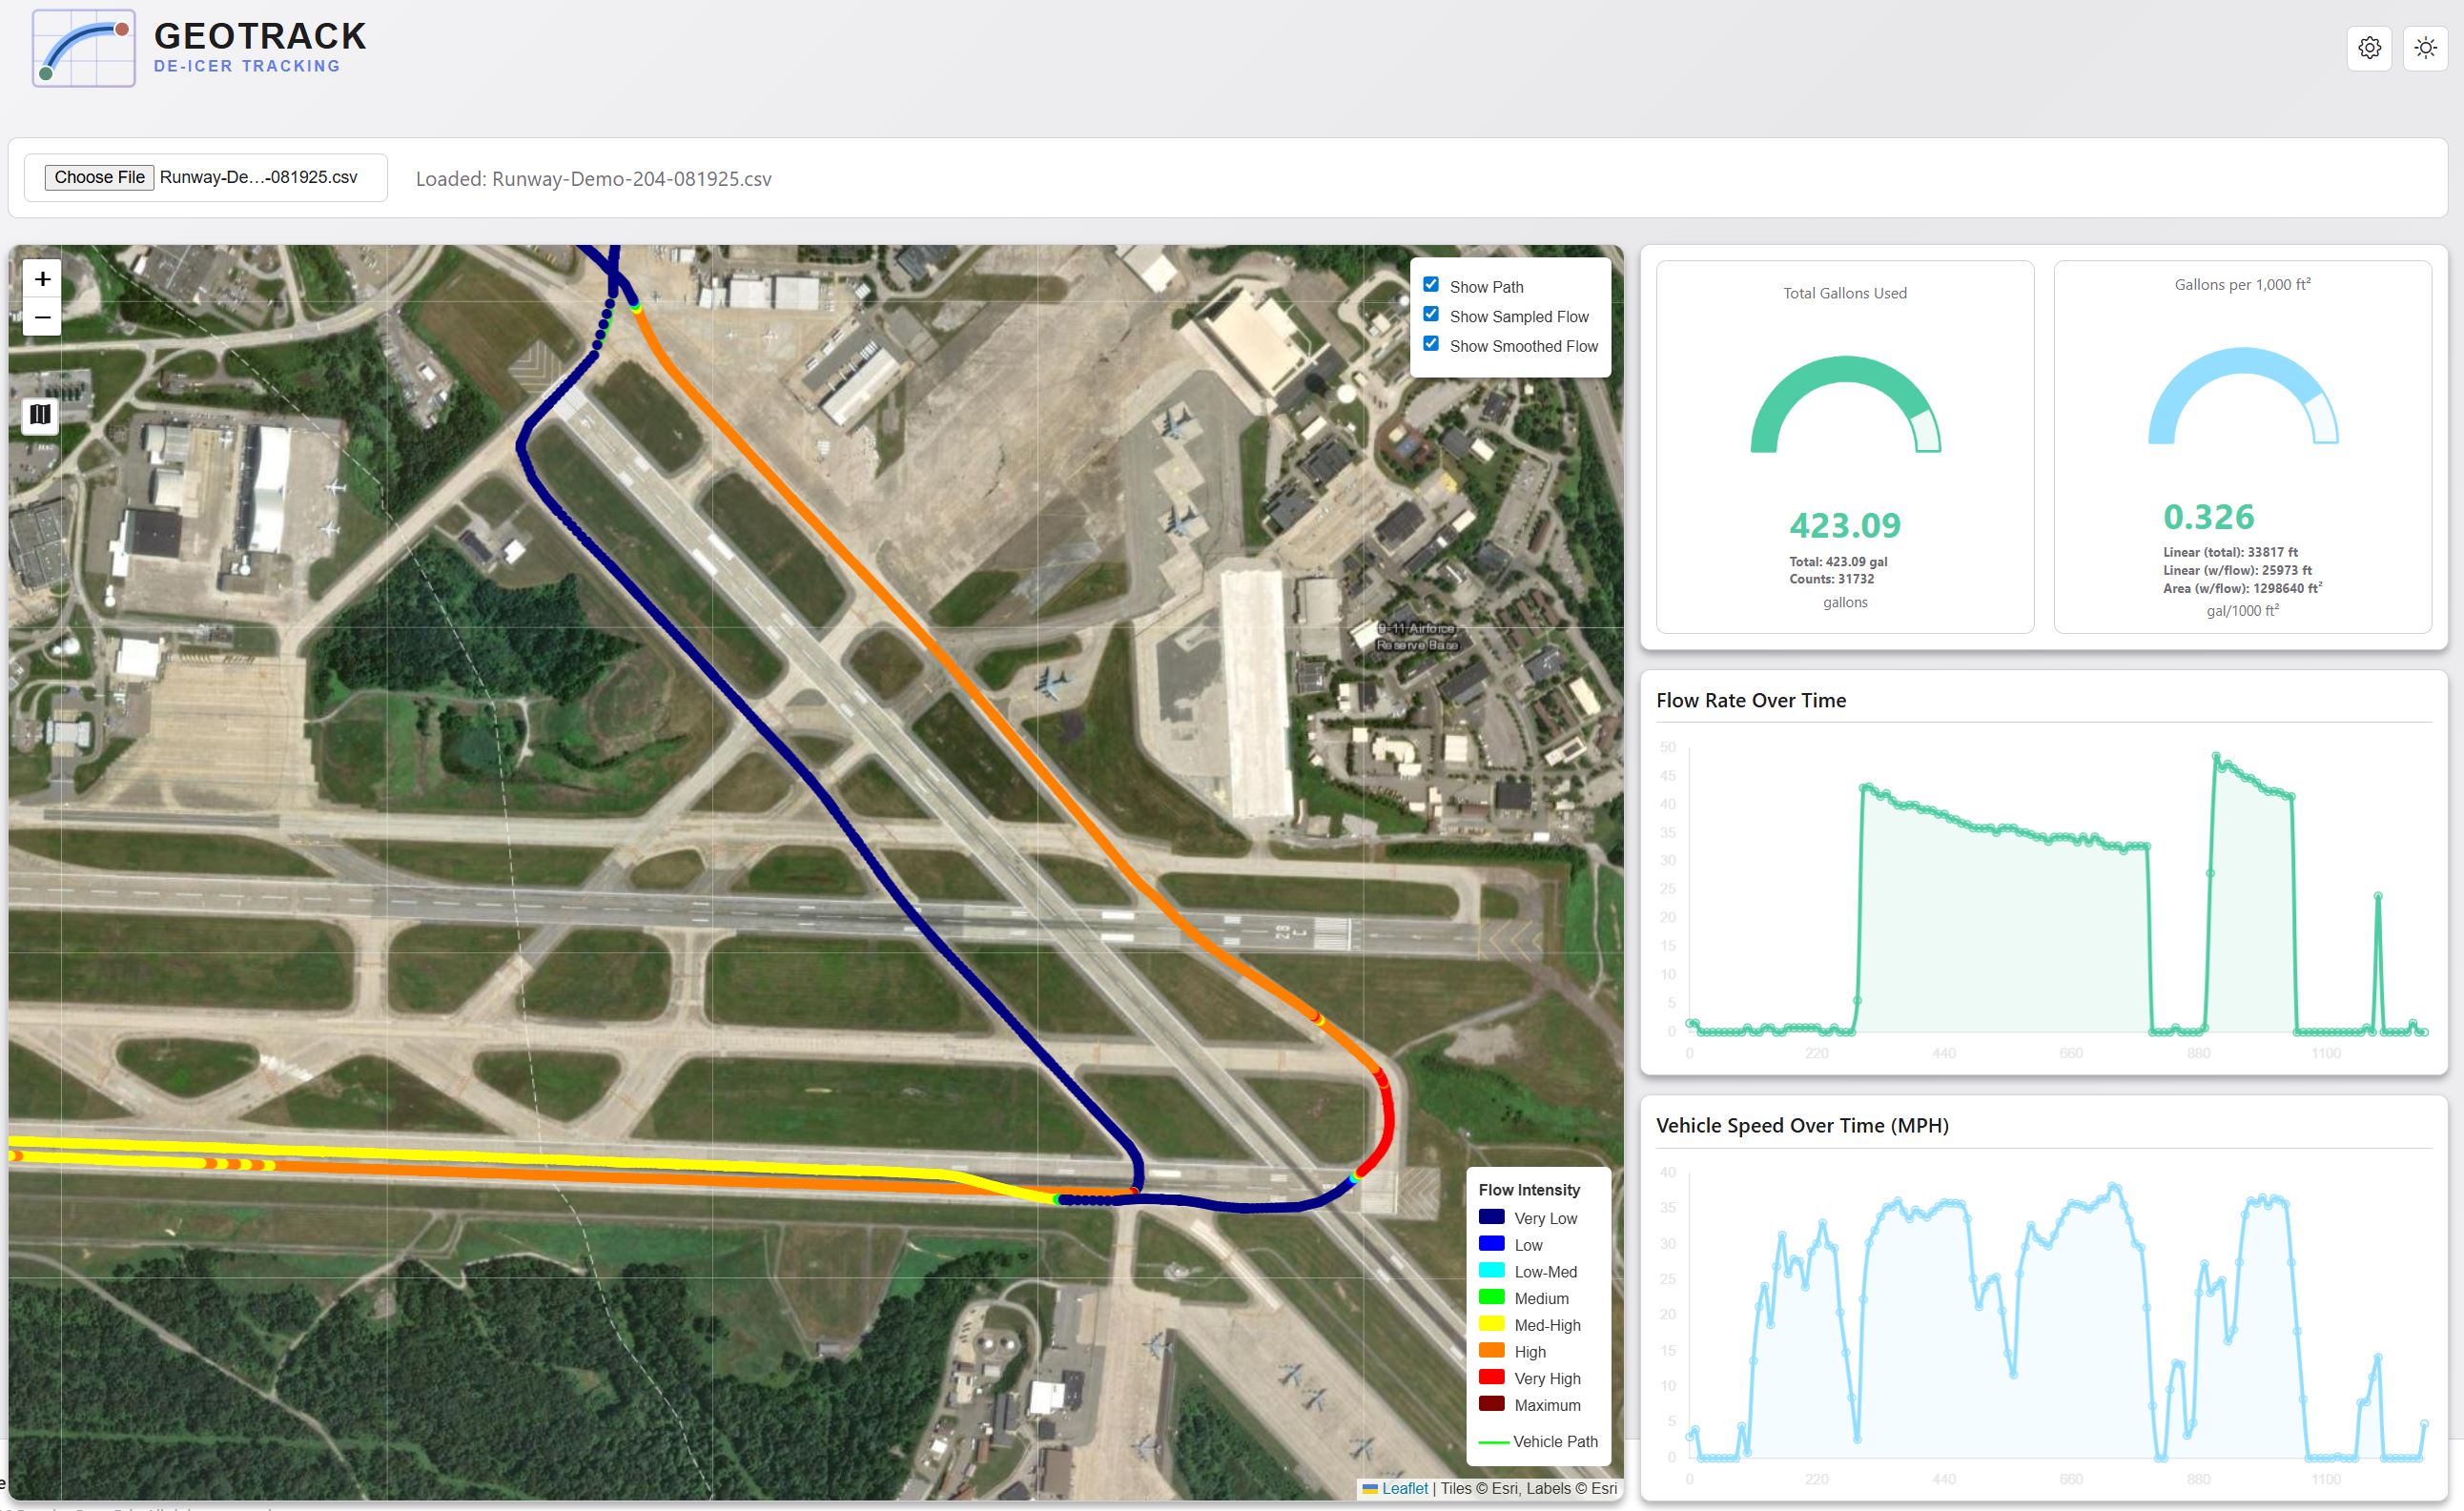
Coverage Maps
Color-coded geographic overlays show exactly where operations occurred, revealing gaps, overlaps, and efficiency opportunities.
- Heat maps showing application intensity
- Path tracking with timestamps
- Multiple basemap options (satellite, street, topographic)
- Zoom and filter by time range or vehicle
Performance Graphs
Time-series charts and statistical analysis reveal trends, identify issues, and track improvements over time.
- Flow rate vs. time visualization
- Vehicle speed and route efficiency
- Material consumption tracking
- Comparison across vehicles or operators
Key Performance Indicators
At-a-glance dashboards highlight critical metrics for operational oversight and management reporting.
- Total volume dispensed per shift
- Average application rate (gallons/sq ft)
- Coverage area completed
- Equipment utilization statistics
Compliance Documentation
Automated report generation creates print-ready documents that satisfy regulatory and audit requirements.
- Timestamped operation logs
- Material usage certification
- Environmental compliance records
- Work completion verification